Part 1 · Foundations
Climate & Weather
Climate as invisible architecture: precipitation, temperature, and weather patterns shaping life across Emery County's elevation gradient.
Ch04 — Climate & Weather
Climate is the invisible architecture of Emery County. It determines which plants grow where, how much water flows in the creeks, when ranchers move cattle to summer pasture, and whether a hiker in the San Rafael Swell carries a water bottle or a snow shovel. The county spans nearly 7,000 feet of elevation — from the Green River bottoms at roughly 4,070 feet to the Wasatch Plateau ridgeline above 11,000 feet — and that vertical range compresses an astonishing diversity of climates into a single county. A July afternoon that bakes the desert flats near Green River at 95°F may find the Wasatch Plateau summit wrapped in a 55°F thunderstorm. Understanding this gradient is the key to understanding everything else about the county’s natural and human geography.
4.1 Temperature Normals & Lapse Rates
Emery County does not have one climate; it has a stack of climates layered by elevation. The standard environmental lapse rate — the rate at which temperature decreases with altitude — averages roughly 3.5°F per 1,000 feet of elevation gain. Applied across the county’s 7,000-foot vertical range, this produces a temperature difference of approximately 24°F between the Green River valley floor and the highest Wasatch Plateau ridges at any given moment. At the low end, the town of Green River (elevation ~4,070 feet) experiences a hot, arid climate. January average highs reach 36°F with lows dropping to 21°F; July average highs climb to 91°F with lows around 71°F. Temperatures rarely fall below 6°F or exceed 102°F, but the extremes define the lived experience: winters are cold enough to freeze irrigation canals solid, and summers are hot enough to discourage midday activity outdoors (Climate-Data.org; USClimateData).
Castle Dale, the county seat at approximately 5,770 feet, sits in the middle of the elevation gradient. Over the course of the year, temperatures typically range from 16°F to 88°F, with the warmest months averaging in the mid-80s and the coldest nights occasionally dipping into the single digits. The summers are warm, dry, and mostly clear; the winters are freezing, snowy, and partly cloudy. Castle Dale rarely drops below 4°F or rises above 95°F, but the comfortable average conceals sharp swings — a clear night in January can plunge 30 degrees below the afternoon high within a few hours (Weather Spark; BestPlaces).

At the high end, the Wasatch Plateau above 10,000 feet has no permanent weather stations, but SNOTEL sites and mountain observations indicate a subalpine to alpine climate with short, cool summers and long, severe winters. Snow can fall in any month, and winter temperatures routinely drop well below zero. The plateau is a different world from the desert below — separated by less than thirty miles of horizontal distance but an enormous gulf in temperature, moisture, and growing season.
On any given summer afternoon, the temperature difference between the Green River valley floor (about 4,070 ft) and the Wasatch Plateau summit (above 11,000 ft) can exceed 35°F — roughly the gap between a hot August afternoon and a crisp autumn morning. The physics is simple: temperature drops about 3.5°F for every 1,000 feet of elevation gain. Applied across Emery County's 7,000-foot vertical range, that adds up to a 24°F difference at any moment. You can drive the entire range in under an hour. Bring a jacket.
4.2 Seasonal Precipitation Patterns
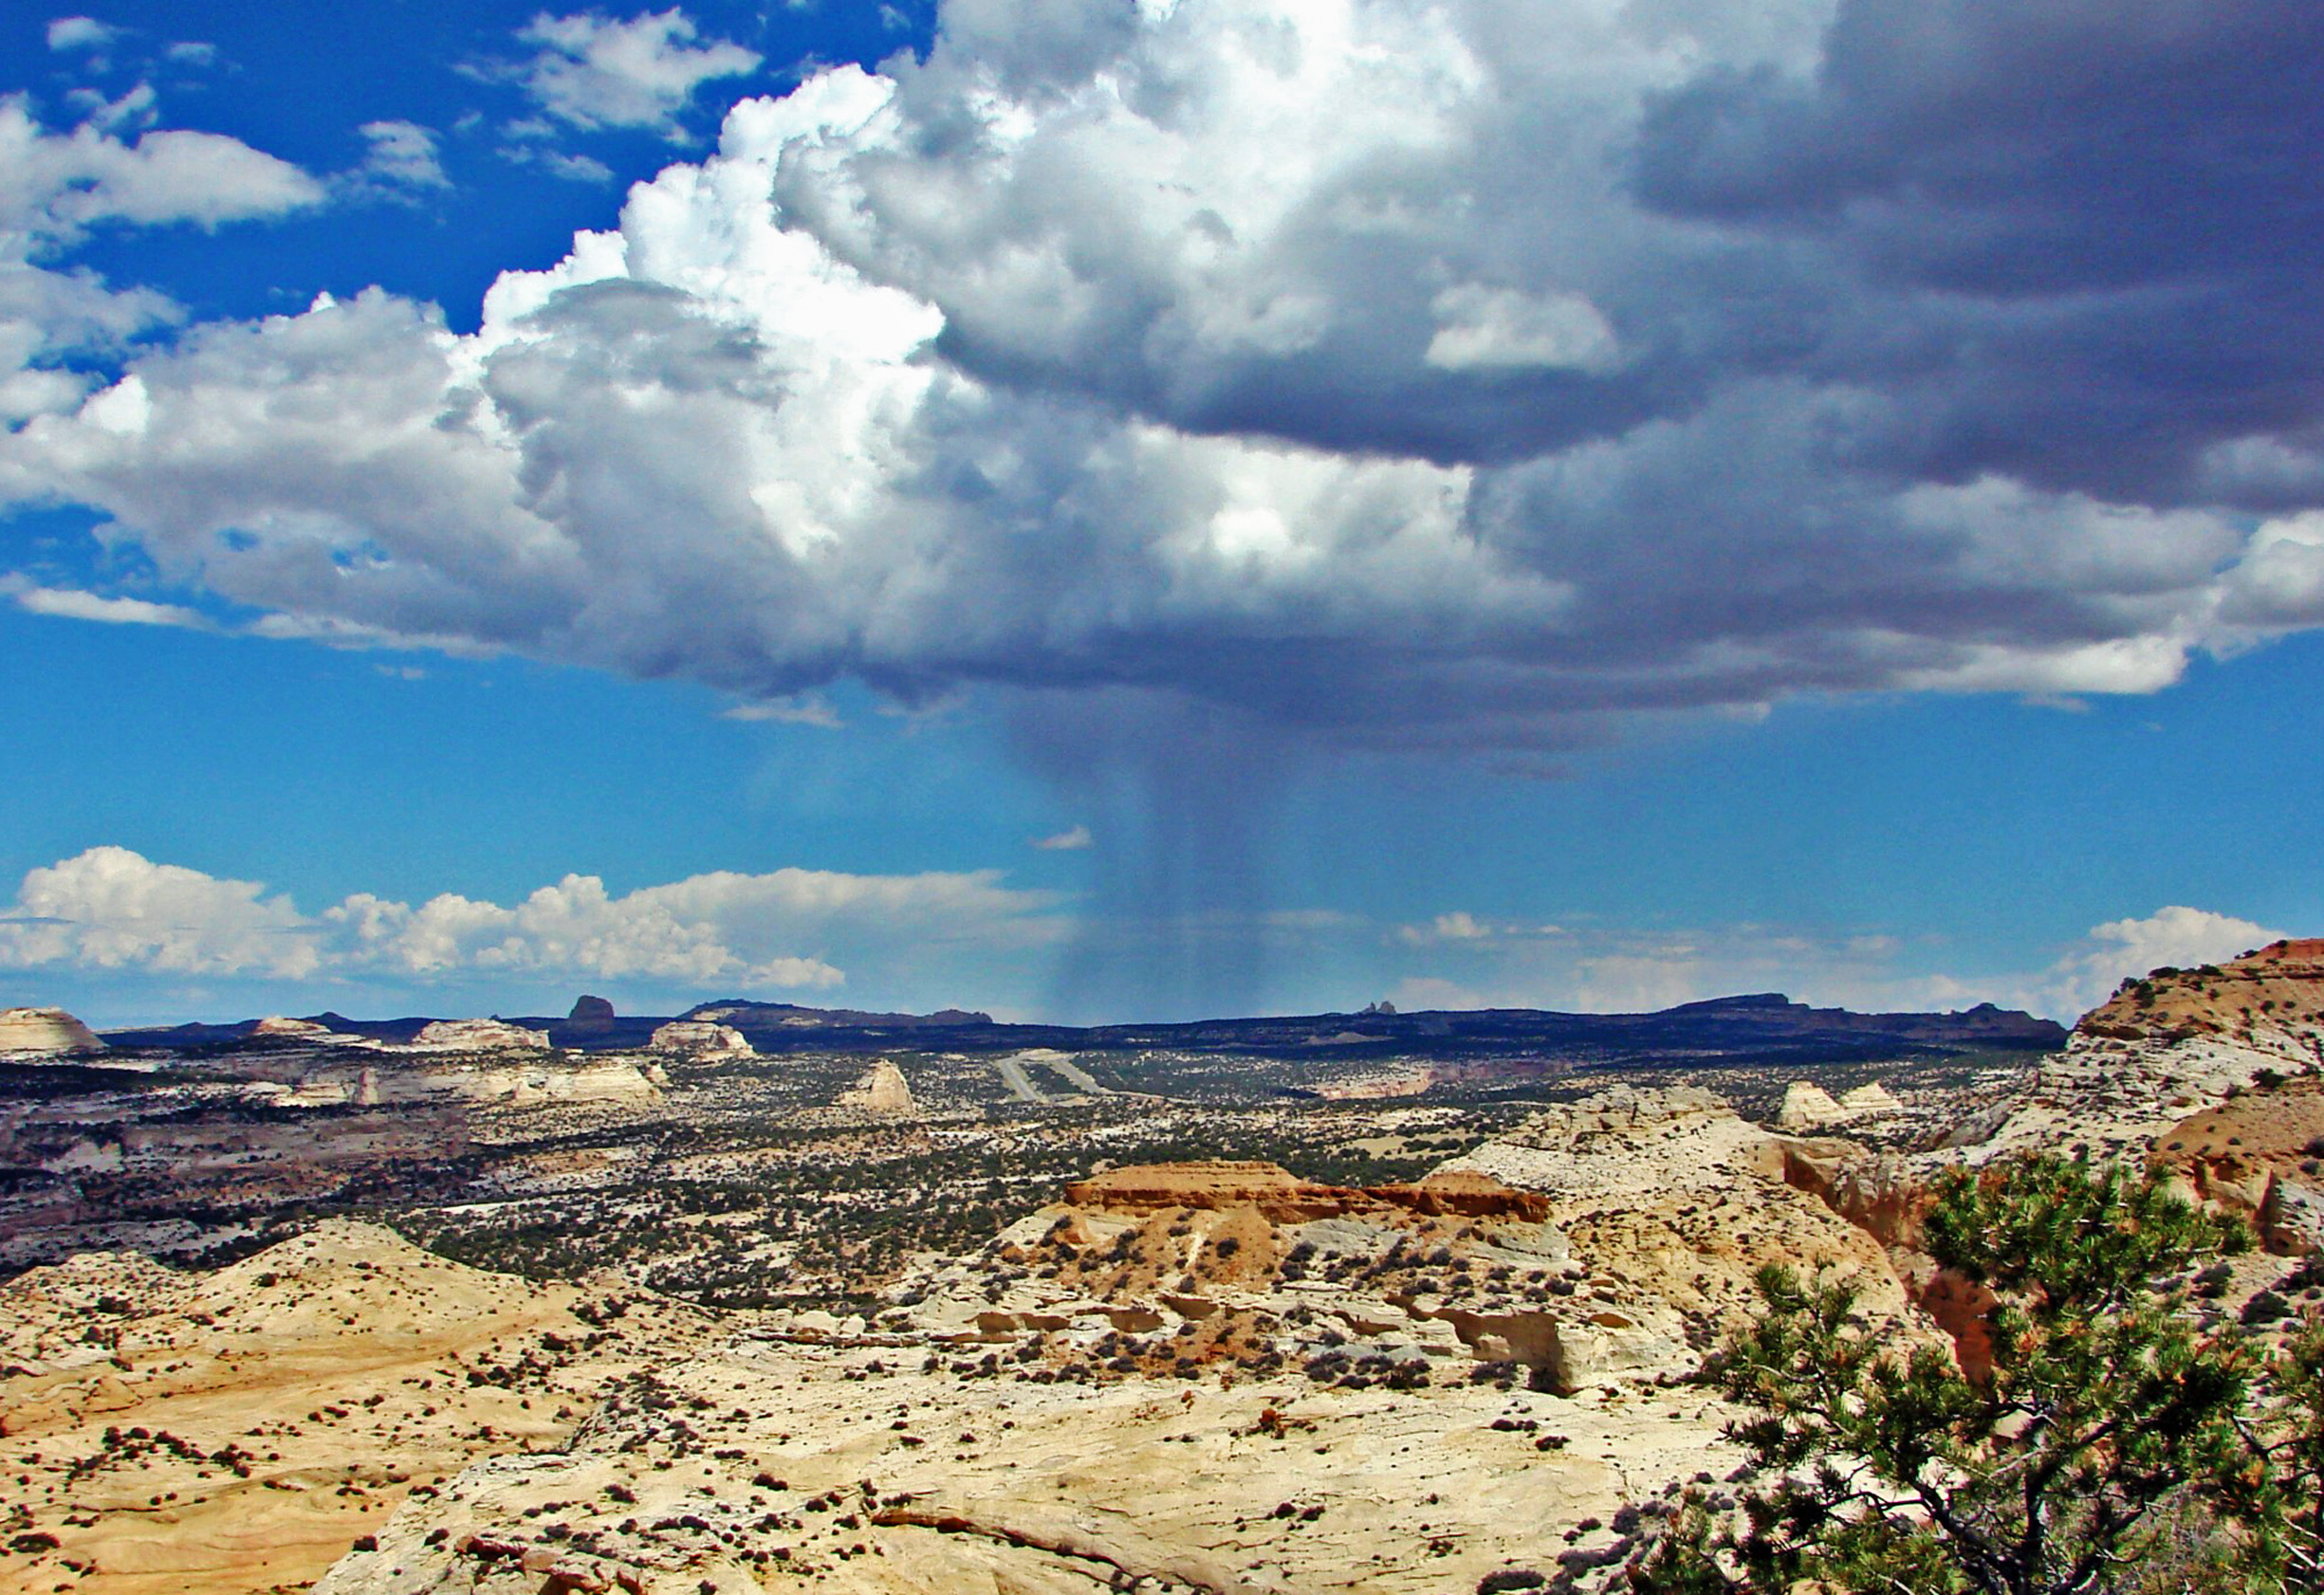
Emery County’s precipitation follows a bimodal pattern shaped by two distinct weather systems. From November through March, Pacific frontal storms track across the Great Basin, delivering widespread precipitation as snow in the mountains and rain or snow in the valleys. From July through September, the North American Monsoon draws moisture northward from the Gulf of California and the Gulf of Mexico, triggering afternoon and evening convective thunderstorms that are intense, localized, and often violent.
At valley stations, annual precipitation is remarkably low. Castle Dale averages roughly 8 inches per year, making Castle Valley semi-arid by any standard classification. The town of Green River, lower and farther from the mountains, receives even less — approximately 6 to 7 inches annually, approaching true desert conditions. Castle Dale averages about 56 days per year with measurable precipitation, and the distribution is roughly even between the winter frontal season and the summer monsoon season, with spring and fall being the driest intervals (BestPlaces; USClimateData).
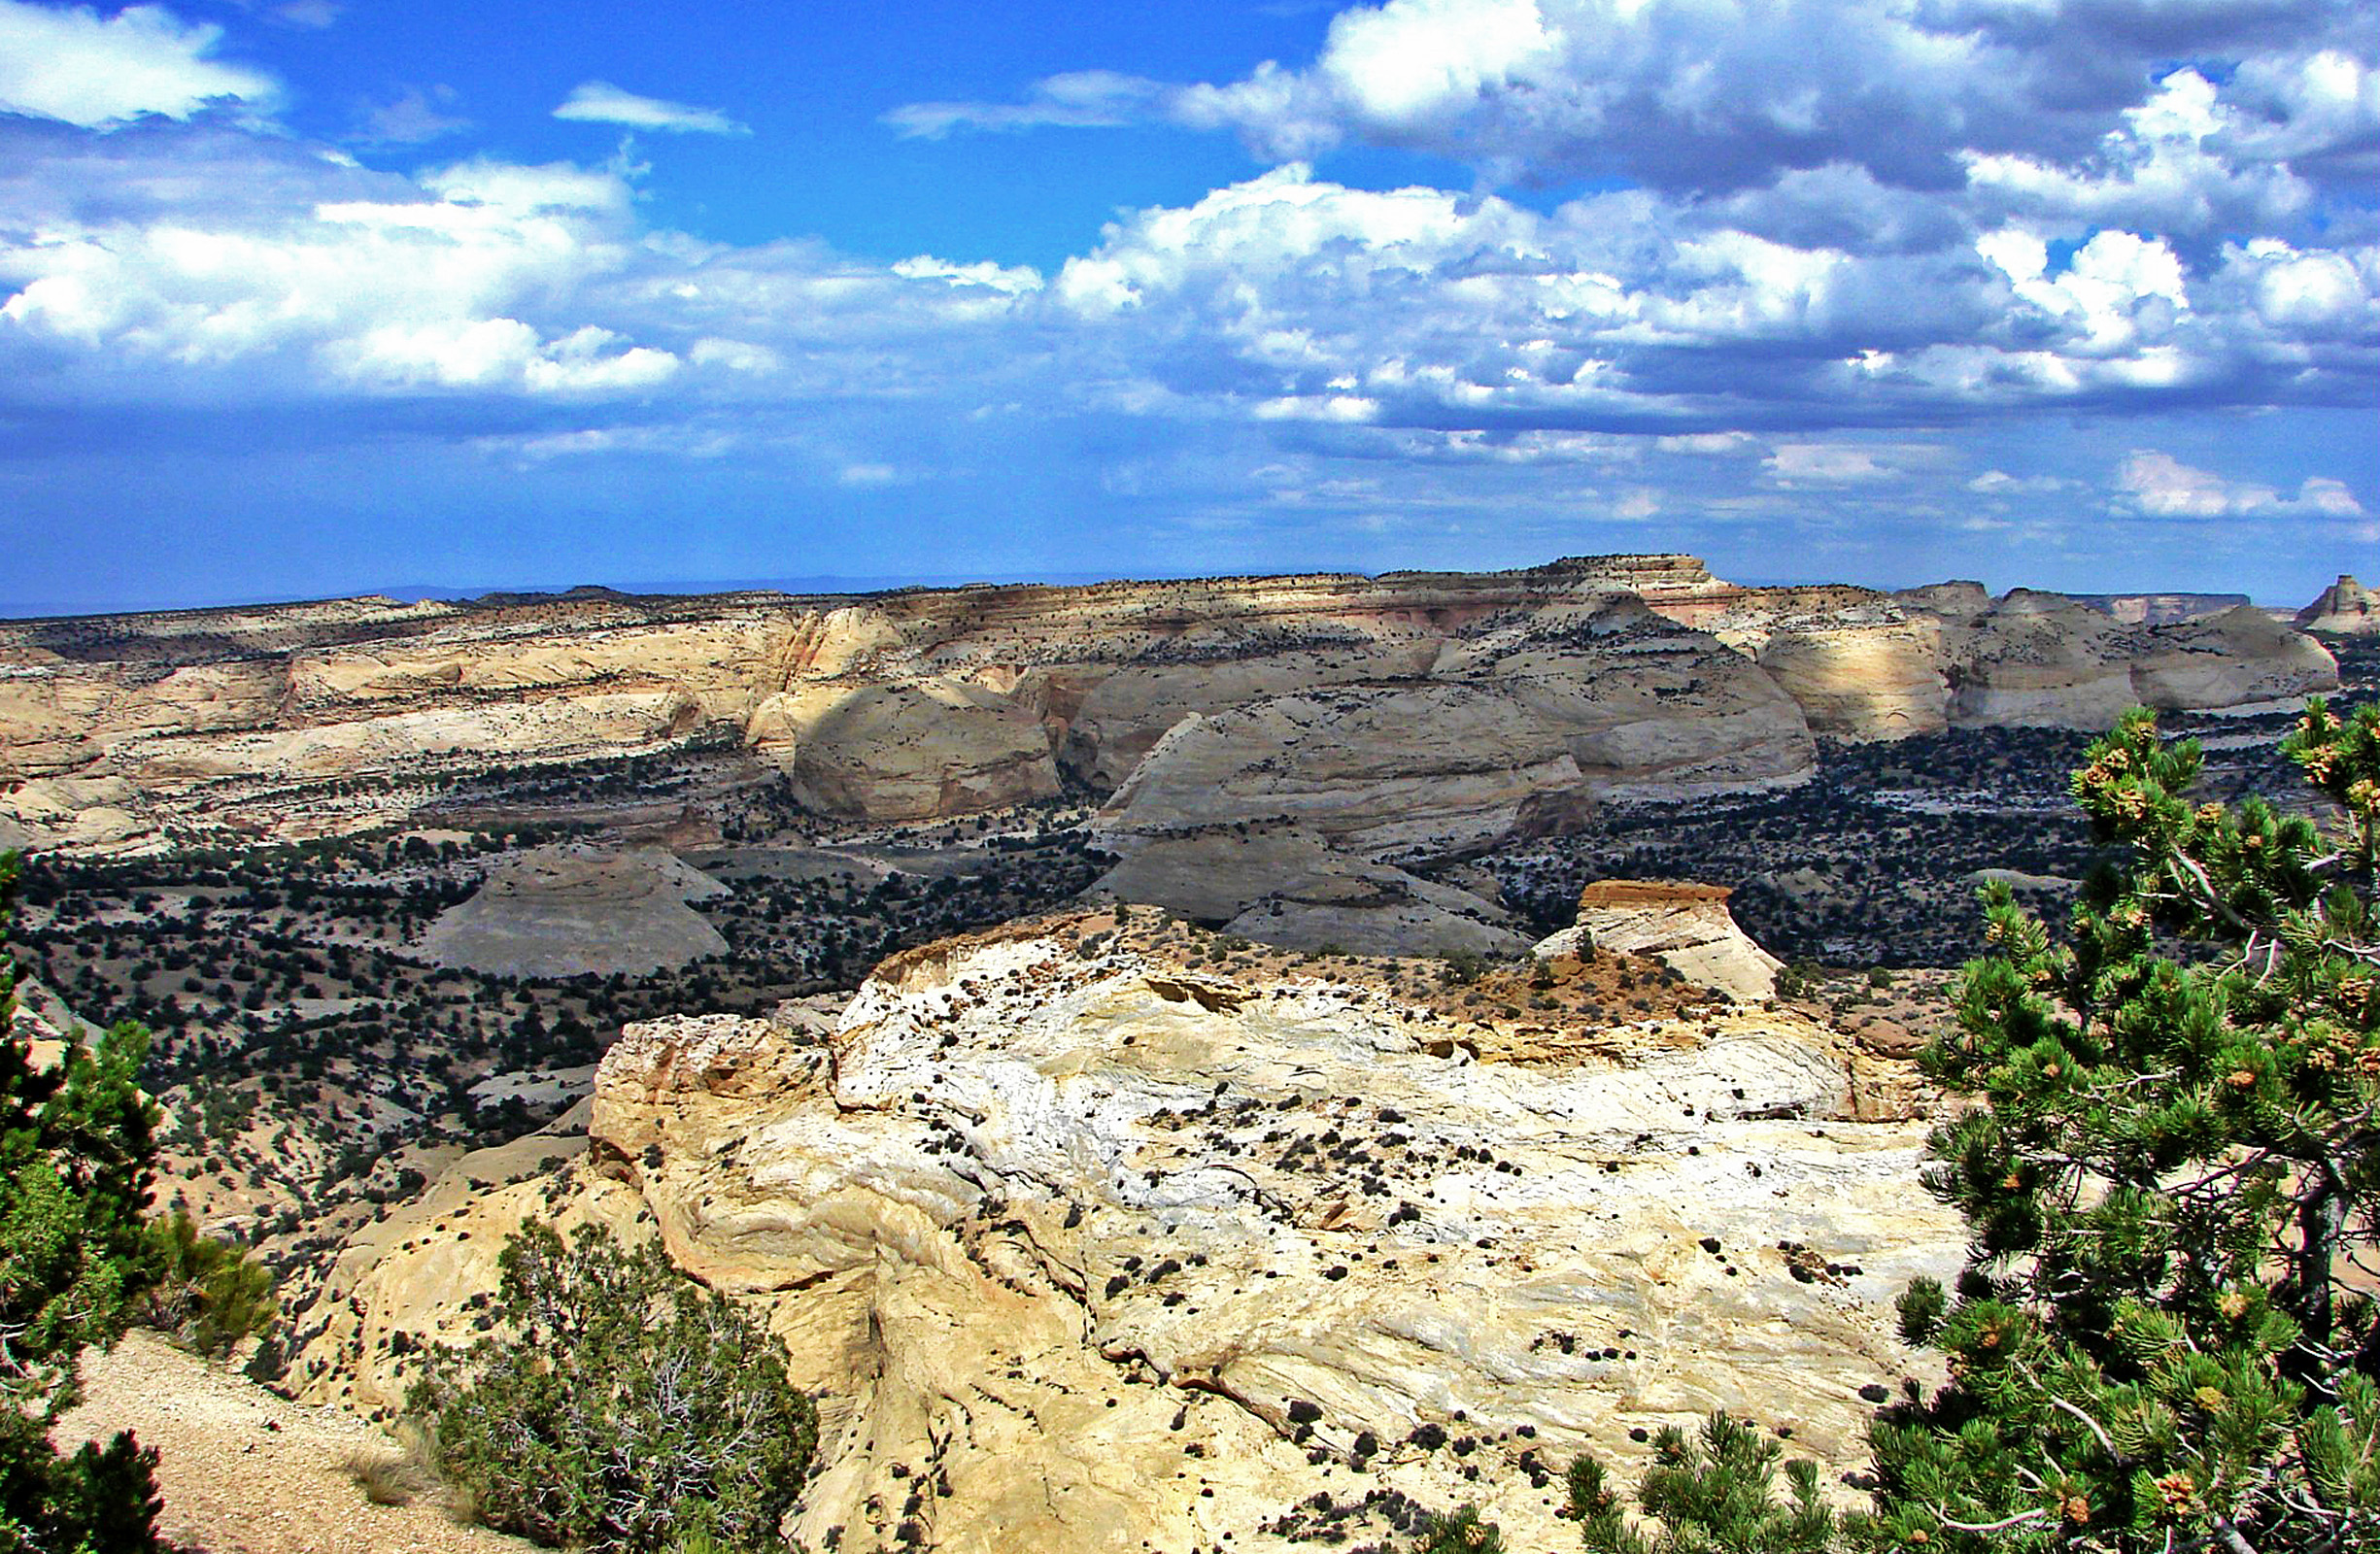
The story changes dramatically with elevation. The Wasatch Plateau intercepts Pacific moisture through orographic lift — as air masses are forced upward over the mountain barrier, they cool and release their moisture as precipitation. Annual totals at the highest elevations likely reach 30 to 40 inches or more, a fivefold increase over the valley floor only twenty miles to the east. This orographic enhancement is the fundamental mechanism that makes Emery County habitable: the mountains wring water from the sky, store it as snowpack, and release it gradually through spring and summer as the snowmelt that fills the reservoirs and feeds the irrigation canals described in Chapter 3.
Build a Backyard Rain Gauge Network
Cut the top off each of three clear plastic bottles at the shoulder. Invert the top section and fit it inside the bottom as a funnel, then tape in place. Use a ruler and marker to mark inches on the outside of each bottle, starting from the bottom. During your visit to Emery County, place one gauge at your lowest-elevation stop (Green River), one at a mid-elevation site (Castle Dale or a canyon campsite), and one at the highest trailhead you reach. After any precipitation, read all three gauges at the same time. Did you measure more rain at higher elevation? If so, you have just demonstrated orographic enhancement — the same mechanism described in Section 4.2 that fills the Wasatch Plateau snowpack every winter.
What you'll need:
Three clear plastic bottles (16 oz or larger), Scissors, Permanent marker, Ruler, Tape
4.3 Snowfall & Snow-Water Equivalent
Snow is the county’s most important form of precipitation — not for what it does when it falls in the valleys, but for what it does when it melts in the mountains. Approximately 95 percent of Utah’s water supply originates as mountain snowpack, and Emery County is no exception. The Wasatch Plateau snowpack, accumulating from October through April at elevations above 9,000 feet, functions as a natural reservoir that stores winter precipitation and releases it gradually through spring and early summer (Utah Division of Water Resources).
At valley elevations, snowfall is modest. Castle Dale averages approximately 19 inches of snow per year, with December through February being the snowiest months. A notable storm in 1988 deposited 12 inches in a single event — a memorable occurrence for a community where heavy snowfalls are the exception rather than the rule. The town of Green River, warmer and lower, averages only about 5 inches of snow annually, spread across roughly 16 snowfall days, with December contributing the most at approximately 2 inches (USClimateData; Climate-Data.org).
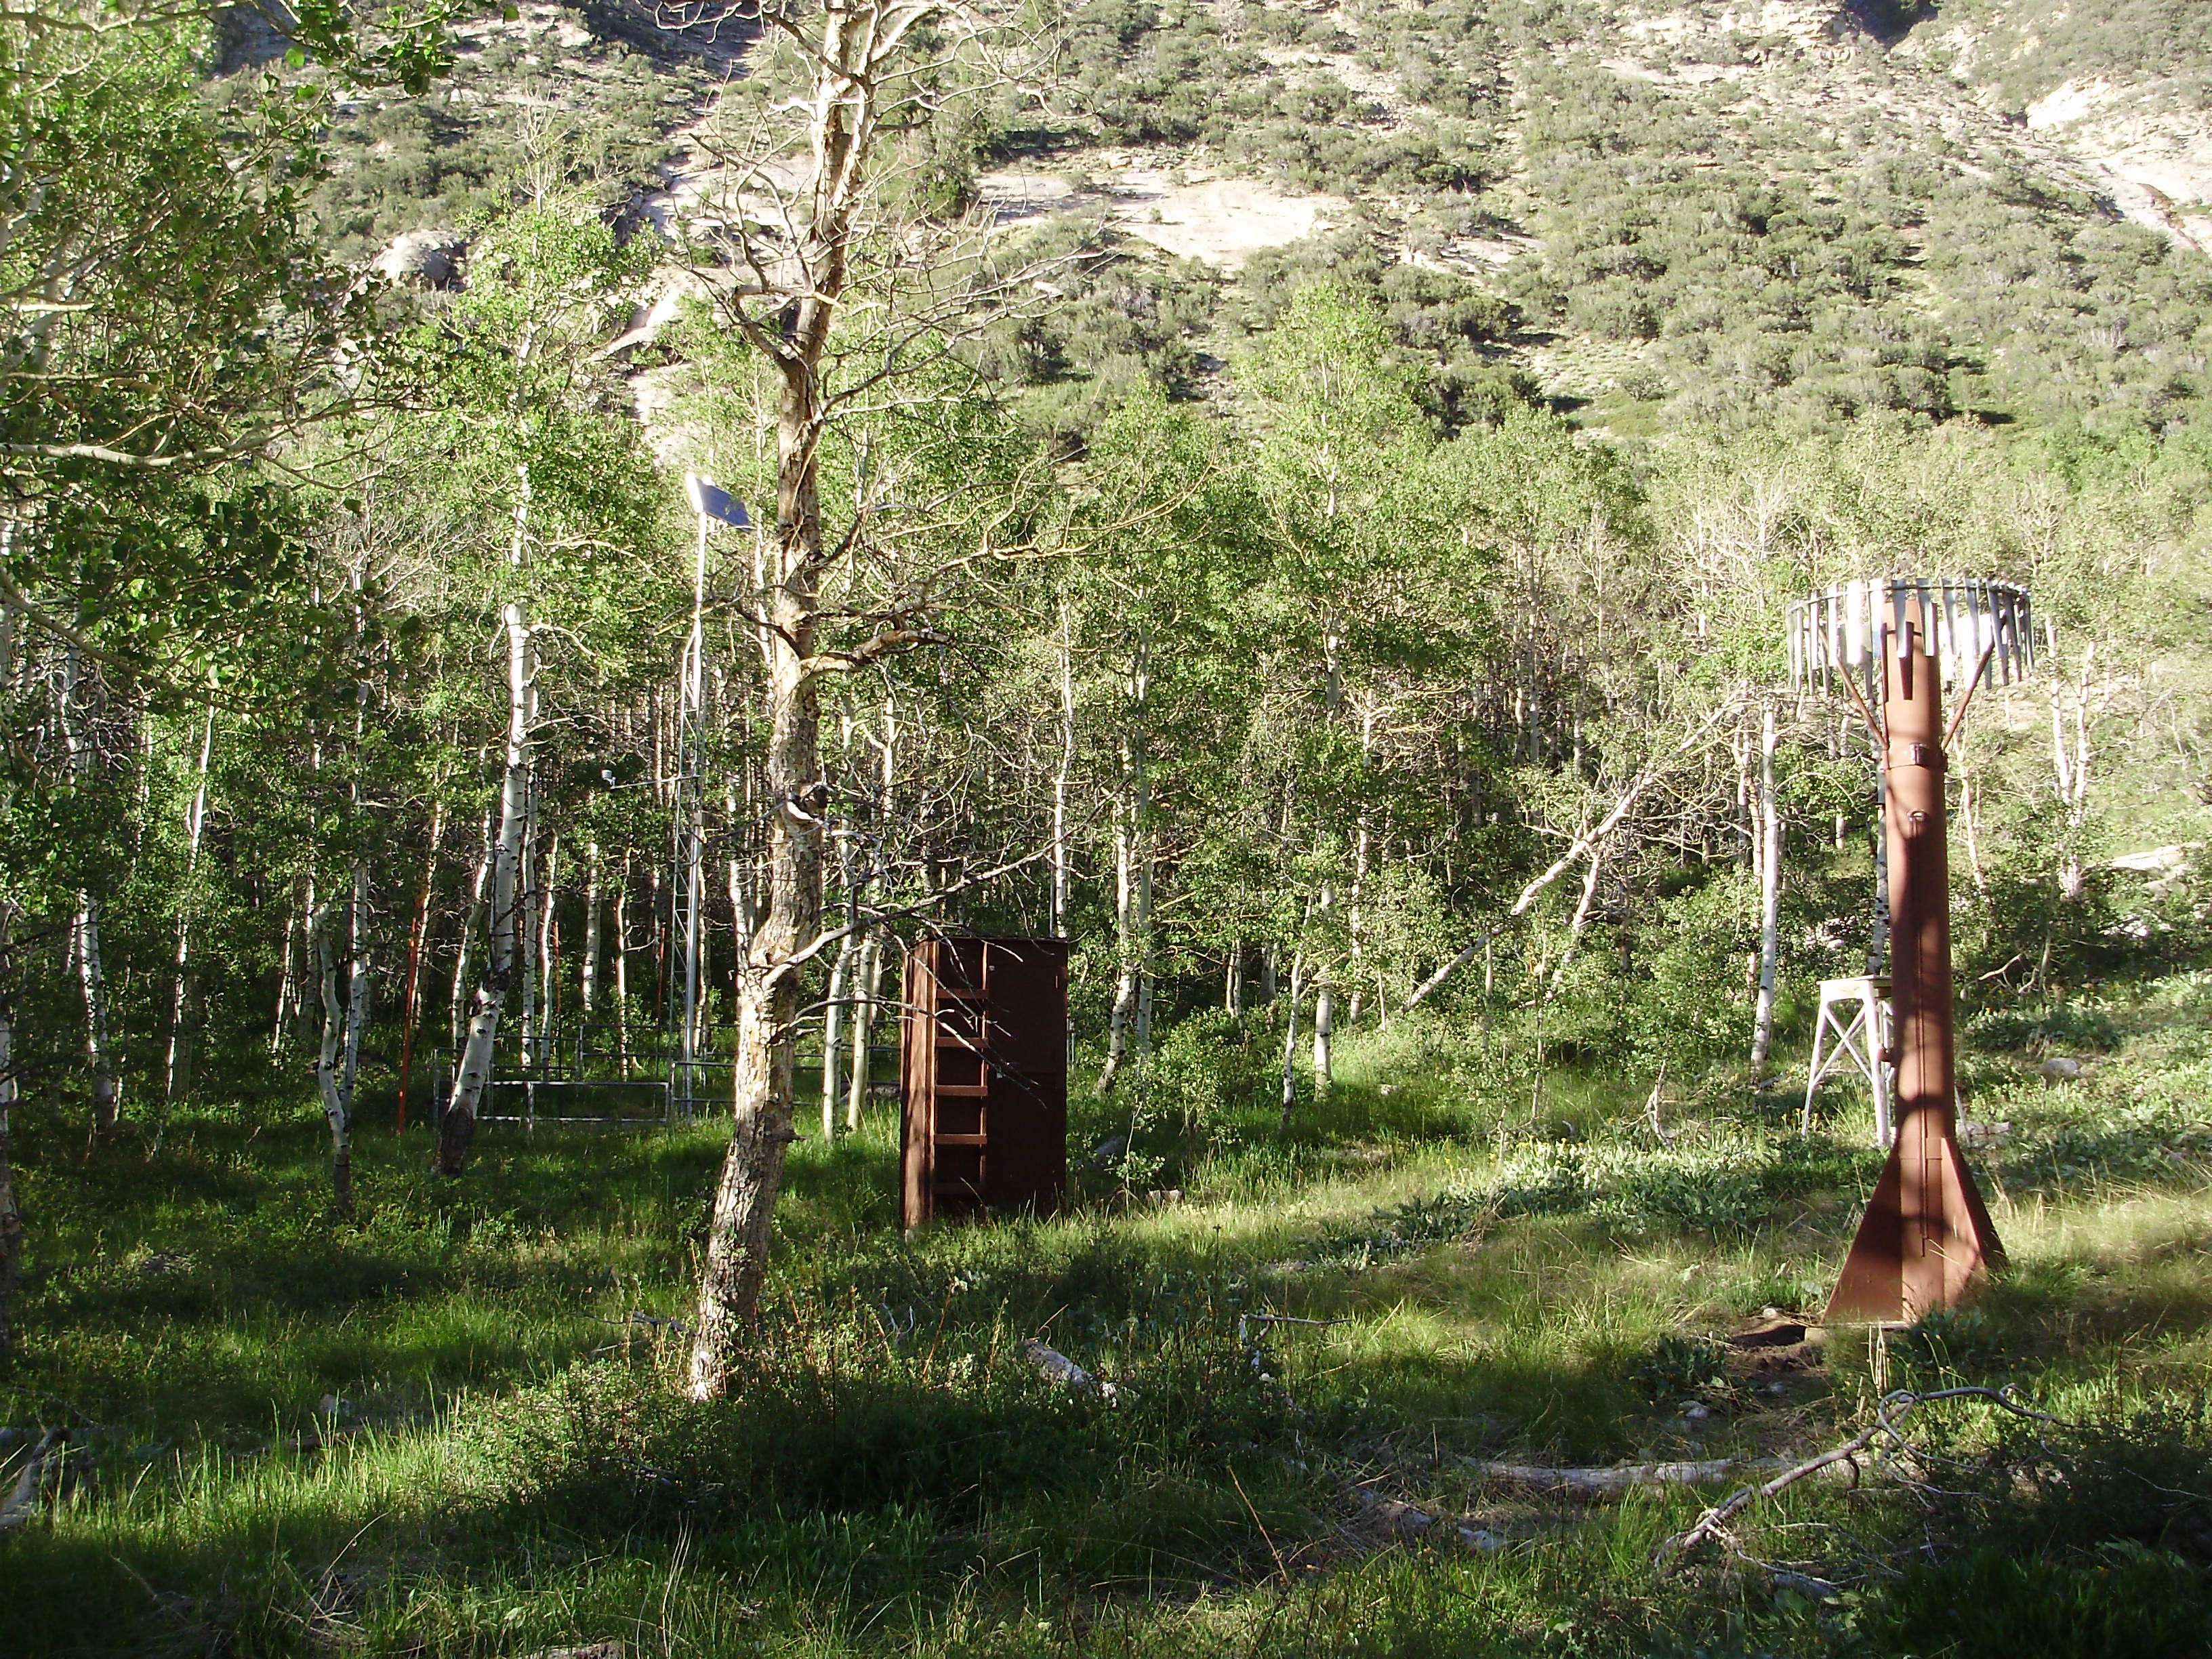
The metric that matters most for water supply is not snowfall depth but snow water equivalent (SWE) — the amount of liquid water contained in the snowpack. The Natural Resources Conservation Service (NRCS) operates a network of SNOTEL (Snow Telemetry) stations across the Wasatch Plateau and other high-elevation areas. Each station is equipped with a snow pillow that weighs the overlying snowpack and converts the measurement to SWE, along with sensors for precipitation, air temperature, and soil moisture. These stations transmit data via satellite, providing real-time information that water managers at the Emery Water Conservancy District (EWCD) use to forecast spring runoff and plan irrigation deliveries.
Peak SWE on the Wasatch Plateau typically occurs in April, just before the onset of rapid snowmelt. In a good water year, peak SWE may exceed 30 inches — meaning the snowpack holds the equivalent of 30 inches of liquid water spread across the measurement area. In a drought year, peak SWE may fall below 15 inches, cutting the available water supply in half and forcing difficult allocation decisions among irrigators, municipalities, and environmental flows downstream.
Snowpack by the Numbers
| Condition | Outcome |
|---|---|
| Good water year — peak April SWE | 30+ inches → full irrigation allocations likely |
| Average water year — peak April SWE | 18–24 inches → normal season, some curtailments possible |
| Drought year — peak April SWE | Under 15 inches → significant shortfalls, allocations cut |
One acre-foot is enough water to cover a football field one foot deep — roughly 326,000 gallons. When peak SWE drops from 30 to 15 inches, the county loses the water equivalent of tens of thousands of household-year supplies before a single crop is planted.
4.4 Extreme Temperature & Precipitation Records
Emery County does not hold Utah’s statewide temperature records — those belong to St. George (117°F, July 5, 1985) and Peter Sinks in Cache County (−69.3°F, February 1, 1985, the second-coldest temperature ever recorded in the contiguous United States, behind Rogers Pass, Montana’s −70°F in January 1954). But the county experiences its own significant extremes that shape daily life and land management.
Summer heat in the Green River corridor can push temperatures above 100°F for multiple consecutive days, stressing livestock, increasing wildfire risk, and creating dangerous conditions for hikers and river runners in the canyons. Winter cold in Castle Valley regularly produces temperatures below 0°F during clear, calm nights when radiative cooling is strongest — the same conditions that produce the county’s exceptional dark skies (see Section 4.9).
Precipitation extremes are arguably more consequential than temperature extremes. The most dangerous weather events in Emery County are not heat waves or cold snaps but flash floods triggered by intense convective rainfall. Thunderstorms during the July–September monsoon season can deposit 2.5 to 4 inches of rain in less than an hour over a small area. When this rain falls on the impermeable Mancos Shale badlands or drains into narrow sandstone slot canyons in the San Rafael Swell, the result is rapid, violent flooding. On August 1, 2021, a flash flood swept down Bear Canyon near the Gentry Mountain coal mine, engulfing three mine vehicles and killing one worker whose body was carried six miles downstream — a stark reminder that extreme precipitation events in canyon country can be lethal with almost no warning (see Ch03, Section 3.7).
[needs additional sources] Specific all-time temperature records for the Castle Dale and Green River cooperative observer stations, including dates of occurrence, need verification from the NOAA Climate Data Online archive or the Utah Climate Center.
4.5 Wind Climatology & Prevailing Directions
Wind in Emery County is shaped by the interaction between regional pressure patterns and local topography. In general, westerly and southwesterly winds prevail, driven by the same Pacific storm track that delivers winter moisture. But the county’s complex terrain — the Wasatch Plateau escarpment on the west, the Book Cliffs to the north, the San Rafael Swell in the center, and the broad Green River valley to the east — channels and modifies airflow in ways that make local wind patterns highly variable.
During summer, thermal heating of the desert floor creates afternoon upslope winds that draw air from the valleys toward the mountains. These thermal winds can be strong enough to generate dust devils on the exposed flats near Green River and to trigger orographic convection — the afternoon thunderstorms that characterize the monsoon season. At night, the process reverses: cool air drains downslope from the Wasatch Plateau into Castle Valley, producing the calm, cold conditions that favor winter temperature inversions and radiative frost.
Wind is both a resource and a hazard. Strong winds during dry periods can generate dust storms that reduce visibility on Interstate 70 — the major east-west transportation corridor that crosses the county — and can contribute to soil erosion on overgrazed or disturbed lands. Spring is typically the windiest season, when the contrast between lingering winter cold and increasing solar heating produces strong pressure gradients across the region.
[needs additional sources] Published wind rose data specific to Emery County weather stations have not been located. The MesoWest observation network and the NWS Salt Lake City office may hold unpublished data that would allow more precise characterization of prevailing directions and seasonal wind speed distributions.
4.6 Thunderstorm Frequency & Lightning Risk
The North American Monsoon transforms Emery County’s summer weather from monotonous sunshine into a daily cycle of building cumulus, afternoon thunderstorms, and evening clearing. From early July through mid-September, moisture streaming northward from the tropical Pacific and the Gulf of Mexico destabilizes the atmosphere over the Colorado Plateau, and the intense surface heating of the desert provides the lift necessary to trigger deep convection.
Thunderstorm frequency peaks in July and August, when afternoon buildups are nearly a daily occurrence over the high terrain and a common sight over the lower desert. The storms are characteristically brief, intense, and highly localized — a thunderstorm may drench one side of a canyon while the other side remains bone dry. Lightning is the most immediate hazard: it strikes exposed ridgelines, mesas, and open desert with little warning, and it is Utah’s deadliest thunderstorm-related hazard (Utah State Hazard Mitigation Plan, Chapter 9). Hikers, ranchers checking livestock, and anyone caught on open ground during a monsoon thunderstorm faces genuine risk.
The secondary hazard is flooding. Because monsoon thunderstorms concentrate heavy rain over small areas, and because much of Emery County’s lower terrain is composed of impermeable Mancos Shale or bare sandstone, rainfall runs off almost immediately rather than soaking into the ground. Slot canyons in the San Rafael Swell — popular recreational destinations including Little Wild Horse Canyon, Crack Canyon, and Bell Canyon — can fill with floodwater from storms occurring miles upstream, completely out of sight and hearing of anyone in the canyon. August is the most dangerous month: statewide, it accounts for 465 recorded flood events, approximately 35 percent of Utah’s entire flood record.
On August 1, 2021, a monsoon thunderstorm dropped intense rain somewhere in the upper watershed above the Gentry Mountain coal mine. The workers in Bear Canyon, miles downstream, had no warning — in canyon country, a flash flood can arrive before any warning can travel. A wall of water and debris swept down the canyon, engulfed three mine vehicles, and carried one worker six miles downstream. The Mancos Shale badlands that cover much of Emery County's lower terrain shed rainfall almost instantly — when two to four inches falls in forty minutes, every canyon becomes a pipe. If you are entering any slot canyon in the San Rafael Swell, check weather forecasts not just for your location but for the entire watershed upstream.
— Emery County records, August 2021
4.7 Drought Indices & Palmer Severity Trends
Drought is not an occasional disruption in Emery County; it is a recurring feature of the climate. The Colorado Plateau has experienced cyclical drought for as long as tree-ring records extend — well over a thousand years — and the instrumental record of the last century fits neatly into a longer pattern of alternating wet and dry periods.
The Palmer Modified Drought Index (PMDI), which integrates temperature, precipitation, and soil moisture into a single measure of relative dryness, has been reconstructed from tree rings for the Colorado Plateau extending back centuries. These reconstructions reveal that the droughts of the 20th century, while severe and economically damaging, were not unprecedented. Megadroughts lasting decades occurred in the 12th, 13th, and 16th centuries — periods when sustained aridity may have contributed to the abandonment of Fremont and Ancestral Puebloan settlements across the region (see Part II, Chapters 8–10).
In the instrumental record, a USGS study documented three distinct multidecadal precipitation regimes on the Colorado Plateau during the 20th century: a wetter period from 1905 to 1941, a drier period from 1942 to 1977, and a return to wetter conditions from 1978 to 1998 (USGS FS-119-02). Current research suggests that the region may now be entering a drier regime resembling the mid-century drought — a trend potentially amplified by anthropogenic warming.
The 1999–2002 drought hit Emery County hard. The USGS documented widespread impacts across Utah, including depleted reservoir storage, reduced streamflow, stressed rangeland vegetation, and increased wildfire activity (USGS FS-037-03). More recently, in April 2025, Governor Spencer Cox included Emery County among seventeen Utah counties in a drought emergency declaration, with southwestern Utah snowpack measuring only 44 percent of normal (Drought.gov). For a county whose agricultural economy depends on mountain snowmelt, such declarations are not abstract policy measures — they represent real reductions in the water available for crops, livestock, and communities.
4.8 Hydroclimatic Teleconnections (ENSO, PDO)
Emery County’s weather is not determined solely by local geography. Large-scale ocean-atmosphere oscillations thousands of miles away exert a measurable influence on the county’s precipitation and snowpack — and understanding these teleconnections helps explain why some winters produce abundant snow while others leave the mountains bare.
The El Niño–Southern Oscillation (ENSO) is the most important of these remote drivers. ENSO describes a cyclical pattern of warming (El Niño) and cooling (La Niña) of sea-surface temperatures in the equatorial Pacific Ocean, with each phase lasting roughly one to three years. On the Colorado Plateau, seasonal precipitation correlates negatively with the Southern Oscillation Index (SOI) at modest but statistically significant levels. In practical terms, strong El Niño episodes tend to increase cool-season precipitation and above-normal snowpack on the Wasatch Plateau, while strong La Niña episodes tilt the odds toward below-normal precipitation and thinner snowpack — a direct threat to Emery County’s irrigation water supply (USGS FS-119-02).
The Pacific Decadal Oscillation (PDO) operates on a longer timescale — decades rather than years — and modulates the effect of ENSO on western U.S. precipitation. When the PDO and ENSO are in phase (both warm or both cool), their precipitation effects reinforce each other; when out of phase, the effects are muted. The three 20th-century precipitation regimes identified by the USGS on the Colorado Plateau are largely synchronous with PDO phase shifts, suggesting that the PDO sets the baseline wetness or dryness around which individual ENSO events oscillate.
For Emery County water managers, the practical implication is that seasonal snowpack forecasts should account for both ENSO phase and PDO phase. A La Niña winter during a negative PDO phase is more likely to produce dangerously low snowpack than a La Niña during a positive PDO phase. The NRCS incorporates these teleconnections into its seasonal water supply forecasts, which EWCD uses to plan reservoir operations and irrigation allocations each spring.
4.9 Dark-Sky Quality & Atmospheric Transparency
One of the most remarkable — and least expected — climate-related assets of Emery County is the quality of its night sky. In 2015, the National Park Service Night Sky Team assessed Goblin Valley State Park in southern Emery County and determined that it possesses “one of the darkest night skies on earth.” The following year, Goblin Valley was designated an International Dark Sky Park by DarkSky International, joining an elite group of sites worldwide recognized for exceptional darkness and active light-pollution prevention.
On the Bortle Scale — a nine-level system used by astronomers to quantify sky darkness, with Class 1 representing the darkest possible skies and Class 9 the washed-out glow of a city center — Goblin Valley rates Class 1. This means that from the park, the zodiacal light, the gegenschein, and the zodiacal band are all visible to the naked eye; the Milky Way casts visible shadows; and faint deep-sky objects that most people have only seen in photographs are discernible without optical aid (DarkSky International; Utah State Parks).
The darkness is a product of climate and geography working together. Emery County’s low population density — fewer than 10,000 people spread across 4,472 square miles — means there are almost no artificial light sources within dozens of miles of the park. The arid climate produces a high percentage of clear nights (the county averages 236 sunny days per year), and low atmospheric humidity and minimal aerosol loading create the transparent air that astronomers prize. The same conditions that make the county a challenging place to farm — dryness, remoteness, sparse population — make it one of the finest places in the continental United States to observe the universe.
This dark-sky resource has growing economic significance. Astrotourism — travel motivated by stargazing and astronomical observation — is an emerging niche within Emery County’s broader outdoor recreation economy. The connection between climate, atmospheric transparency, and night-sky quality is developed further in Chapter 7 (Night Skies & Astronomy).
Goblin Valley State Park rates Bortle Class 1 — the absolute darkest classification in the nine-level scale astronomers use to measure sky darkness. On the nine-point Bortle Scale, Class 1 means the zodiacal light is visible to the naked eye, the Milky Way is bright enough to cast shadows on the ground, and faint galaxies millions of light-years away are visible without a telescope. In most American cities, light pollution washes out everything fainter than the Moon and a handful of bright stars. From Goblin Valley, on a moonless night, you can see thousands. The dark sky is a product of Emery County's dryness and emptiness — the same conditions that make farming difficult make stargazing extraordinary.
— DarkSky International, 2016; NPS Night Sky Team, 2015
4.10 Climate Monitoring Stations & Data Sources
The systematic measurement of Emery County’s climate depends on several overlapping observation networks, each serving different purposes and operating at different spatial scales.
The oldest continuous records come from the NOAA Cooperative Observer Network (COOP), whose volunteer observers at stations in Castle Dale, Green River, and other communities have recorded daily maximum and minimum temperatures and precipitation totals for decades. These stations provide the foundation for the 1991–2020 Climate Normals published by NOAA’s National Centers for Environmental Information (NCEI) — the standard reference for “normal” temperature and precipitation at any given location.
At higher elevations, the NRCS SNOTEL network provides automated, real-time data from remote mountain sites. SNOTEL stations on the Wasatch Plateau measure SWE, precipitation, air temperature, and soil moisture via satellite telemetry, transmitting data that is critical for spring runoff forecasting and irrigation planning. The data is publicly accessible through the NRCS Water and Climate Center and through the Utah Snow Survey program.
The Utah Climate Center at Utah State University operates more than 140 research-grade weather stations distributed across four primary networks throughout the state. These stations supplement the NOAA and SNOTEL networks with additional parameters and spatial coverage, and the center serves as the state’s primary repository for climate data and analysis.
At the local level, the Emery Water Conservancy District (EWCD) maintains its own monitoring infrastructure, including real-time data for reservoir levels, canal flows, and weather conditions throughout the water delivery system. EWCD’s website (ewcd.org) provides public access to current conditions — a practical resource for farmers making irrigation decisions and recreationists planning reservoir visits.
Additional data sources include USGS streamflow gages (which co-record water temperature and sometimes air temperature), the MesoWest observation network (which aggregates real-time weather data from multiple networks across the Intermountain West), and the Utah Division of Environmental Quality’s air monitoring stations.
[needs additional sources] A comprehensive inventory of all active weather stations within Emery County, including station names, elevations, parameters measured, and periods of record, would provide valuable reference information for this section. The NCEI station locator tool and MesoWest station map could support this compilation.
4.11 Observed Climate Change Signals
The climate of Emery County is not static. Over the past half century, measurable changes in temperature, snowpack, and the timing of seasonal events have accumulated to the point where they are visible not only in instrument records but in the landscape itself.
Since 1970, average annual temperatures across Utah have warmed by approximately 2°F, with the strongest warming occurring in winter — the season that matters most for snowpack accumulation (NCICS State Climate Summary 2022). Warmer winters shift the boundary between rain and snow to higher elevations, meaning that precipitation that once fell as snow at 7,000 or 8,000 feet increasingly falls as rain that runs off immediately rather than accumulating in the snowpack. The practical effect is a reduction in the natural water storage that the Wasatch Plateau provides.
Snowpack itself shows a declining trend. Across the Colorado Plateau and the broader Intermountain West, snow water equivalent has diminished in recent decades as warmer temperatures consume snow through sublimation and accelerate spring melt. Peak streamflow on Wasatch Plateau tributaries has shifted earlier by an estimated one to three weeks over the last fifty years, compressing the window during which reservoirs can fill and reducing the duration of reliable irrigation supply.
The most dramatic signal is the twenty-first-century megadrought. From approximately 2000 through 2022, the American Southwest — including the Colorado Plateau and Emery County — experienced what tree-ring reconstructions have identified as the driest 22-year period in at least 1,200 years. This was not solely a consequence of reduced precipitation; warmer temperatures increased evaporative demand, drawing more moisture from soils, vegetation, and surface water. The combination of modest precipitation declines and significant temperature increases produced a drought more severe than any in the instrumental record and comparable to the most extreme megadroughts of the medieval period.
For Emery County, the consequences have been tangible: reduced reservoir storage, stressed rangeland, increased wildfire risk at higher elevations, and growing pressure on an agricultural water system designed for a climate that may no longer exist in its historical form.
4.12 Projected Future Climate Scenarios & Local Impacts
Climate models developed under the Coupled Model Intercomparison Project (CMIP5 and CMIP6) project continued and accelerating changes for the Colorado Plateau through the remainder of the 21st century. The specific magnitude of change depends on future greenhouse gas emissions, but all scenarios project substantial warming, and most project changes in the seasonal distribution and intensity of precipitation.
Temperature projections for Utah indicate average increases of 3 to 6°F by the 2060s and 4 to 10°F by the end of the century, depending on the emissions pathway. By mid-century, winter temperatures may be roughly 3°F warmer and summer temperatures about 3.6°F warmer compared to the 1991–2020 baseline (Utah Division of Water Resources, 2020; Utah SHMP Chapter 12). For Emery County, this means fewer frost days in the valleys, longer growing seasons, and higher evaporative demand — a combination that increases agricultural water needs at precisely the time when supply is declining.
Snowpack projections are sobering. Snow water equivalent values across the Colorado Plateau are projected to decline by 10 to 15 percent by the 2060s and by as much as 30 percent by the end of the century. The rain-snow transition elevation will continue to rise, reducing the area over which winter precipitation accumulates as storable snow. Colorado River flows — into which all of Emery County’s water ultimately drains — are predicted to decline by 20 to 30 percent by mid-century, a reduction that will cascade through the entire allocation system from headwaters to the Mexican border (Colorado River Science; Utah Rivers Council).
For a county that depends on mountain snowmelt for its farms, its towns, and its reservoirs, these projections describe a future that requires adaptation. Potential responses include: improving irrigation efficiency to stretch existing water supplies (canal lining, conversion from flood to sprinkler or drip irrigation), developing additional groundwater sources where sustainable yields exist, adjusting crop selections toward less water-intensive varieties, and exploring interbasin water transfers or aquifer storage and recovery programs.
The projections also carry implications beyond agriculture. Warmer temperatures and shifting precipitation patterns may alter vegetation zones described in Chapter 5, potentially pushing pinyon-juniper woodlands higher and expanding sagebrush desert at lower elevations. Wildfire seasons will likely lengthen. Flash flood intensity may increase as a larger fraction of precipitation falls in extreme events. And the dark-sky resource that draws astrotourists to Goblin Valley may paradoxically benefit from one aspect of climate change: warmer, drier conditions produce clearer skies, even as they stress the terrestrial landscape below.
Sources
- NCICS, “Utah — State Climate Summaries 2022” (statesummaries.ncics.org/chapter/ut/).
- USGS FS-119-02, “Precipitation History of the Colorado Plateau Region, 1900–2000” (2002).
- USGS FS-037-03, “Drought in Utah, 1999–2002.”
- DarkSky International, “Goblin Valley State Park Dark Sky Park” (darksky.org).
- Utah State Parks, “Goblin Valley Is ‘Dark Sky Certified!’” (stateparks.utah.gov, 2016).
- Utah Division of Water Resources, “Climate Change, Water Resources, and Potential Adaptation Strategies in Utah” (2020).
- Utah Hazard Mitigation Plan, Chapter 12: Climate Change (hazards.utah.gov).
- Colorado River Science, “Projected Future Climate” (coloradoriverscience.org).
- Utah Rivers Council, “Climate Change” (utahrivers.org).
- Drought.gov, “Emery County Conditions” (drought.gov/states/utah/county/Emery).
- NRCS, “Utah Snow Survey Program” (nrcs.usda.gov/utah/snow-survey).
- Utah Climate Center, Utah State University (climate.usu.edu).
- NOAA NCEI, “U.S. Climate Normals, 1991–2020” (ncei.noaa.gov).
- USClimateData, “Castle Dale, UT” and “Green River, UT” (usclimatedata.com).
- Weather Spark, “Castle Dale, UT” (weatherspark.com).
- Climate-Data.org, “Green River, UT” (en.climate-data.org).
- NPS, “Monsoon Season” (nps.gov/articles/monsoon-season.htm).
- Utah Division of Water Resources, “Snowpack” (water.utah.gov/snowpack/).
- Emery Water Conservancy District (ewcd.org).
Proposed Maps & Figures
- Map: Emery County Elevation–Climate Zones — Show the county with color-coded bands for arid desert (<6,000 ft), semi-arid valley (6,000–7,500 ft), montane (7,500–9,500 ft), and subalpine/alpine (>9,500 ft). Mark weather stations and SNOTEL sites.
- Figure: Monthly Climograph — Castle Dale — Bar chart showing mean monthly precipitation; line showing mean monthly temperature. Based on 1991–2020 NOAA normals.
- Figure: Monthly Climograph — Green River — Same format as Castle Dale for comparison.
- Figure: Annual Precipitation Gradient — Cross-section from the Green River (~6 in) to the Wasatch Plateau summit (~40 in), illustrating the orographic enhancement.
- Figure: Wasatch Plateau SWE Trends — Multi-decade time series of peak April SWE from relevant SNOTEL stations, with trend line showing decline.
- Figure: Drought Monitor History — Color-coded time series of U.S. Drought Monitor classifications for Emery County, 2000–present.
Proposed Tables
- Monthly Climate Normals — Castle Dale and Green River — Temperature (mean, max, min), precipitation, snowfall for each month. Based on 1991–2020 NOAA normals.
- SNOTEL Stations Relevant to Emery County — Station name, elevation, parameters measured, period of record.
- 20th-Century Precipitation Regimes — Start year, end year, characterization (wet/dry), mean annual precipitation departure from long-term average.
- Projected Climate Changes for the Colorado Plateau — Time horizon (2040s, 2060s, 2100), temperature change range, SWE change range, Colorado River flow change range, by emissions scenario.
Weather Detective Hunt
- □ A flash flood debris line — a band of sticks, leaves, and mud deposited on the walls of a wash or canyon above the current channel floor. That line marks the high-water mark of a past flood.
- □ A named cloud type — cumulus (puffy white), cumulonimbus (towering dark thunderhead), or cirrus (high wispy streaks). Photograph it and label it.
- □ Evidence of wind erosion on sandstone — smooth, sculpted surfaces on exposed rock faces, especially on fins and hoodoos in the San Rafael Swell.
- □ A dust devil on a summer afternoon — the open flats near Green River are your best location. Watch for spinning columns of dust moving across the desert floor.
- □ A temperature reading from two elevations in the same day. Record both, calculate the difference, and compare it to the predicted 3.5°F per 1,000 feet from Section 4.1.
- □ The Milky Way from a dark location — drive at least 10 miles from any town, let your eyes adjust for 20 minutes, and look toward the southeast sky in July or August.
- □ A NOAA cooperative observer weather station or rain gauge — ask at the county offices in Castle Dale; some are on public view.
Share your finds! #EmeryEncyclopedia
The Vertical Climate Drive: Green River to Huntington Canyon
Drive 7,000 feet of elevation and cross four climate zones in a single half-day.
On the ground
Record the temperature at Green River (4,070 ft): sparse desert scrub, bare sandstone, shimmering heat in summer. Drive to Castle Dale (5,770 ft): noticeably cooler, irrigated fields, cottonwoods along the creek. Continue up SR-31 through Huntington Canyon: watch the vegetation shift from sagebrush to pinyon-juniper, then to aspen and spruce-fir as you climb through 7,000, 8,000, and 9,000 feet. At Electric Lake or the Skyline Drive turnoff (~10,000 ft): record the temperature again. The difference from Green River should be 20°F or more — you have just driven through the full lapse rate described in Section 4.1.
See also: Chapter 3 (Hydrology & Springs) · Chapter 5 (Flora Zones)